An Indicator diagram is taken to access the performance of each cylinder unit for the ship’s engine. The idle diagram is then compared with the obtained one; that is taken at frequent interval. This helps us know of any deviation or irregularity in the combustion condition and its associated parameters inside the cylinder.
This can be then used to determine total power generated for the engine; compression pressure, peak pressure and efficiency of the engine. Similarly, any deviation in the diagram helps us know of any irregularity in fuel injection and conditions of running gears. Consider it as a tool to read real-time conditions of an engine; much like a stethoscope.
An indicator diagram is recorded on ships using a special instrument called an “indicator instrument“. Which consists of a small piston locked within a cylinder acting against a calibrated spring. The instrument itself can be used to draw all major types of indicator diagrams used to study and rectify engine parameters.
Understanding Types Of Indicator Diagram
There are total four types of indicator diagram of which the three ( Draw card, Powercard, and Light spring ) are important. They help us know of the peak pressure, actual power generated, the compression inside the cylinder, combustion process and indication of faulty parts and liner wear.
These readings are thus important in proper maintenance and working of the engine and can be taken; with the help of both digital and mechanical indicator instruments. The mechanical indicator instrument is mounted on the indicator cock for taking the measurement. For digital measurement,s we use transducers fitted at indicator cock with incremental encoder fitted on to the engine.
Together they allow for proper synchronization of pressure and crank angle data. The data taken is then processed and displayed digitally on the screen for easy access.
1 ) Power Card Diagram
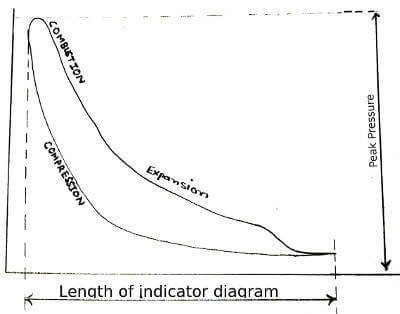
This type of diagram is taken to represent the total work done by the system during one complete revolution. It also helps us know of the peak pressure and damage or leakage of the fuel injector. The total work-done from the cylinder unit is obtained by calculating the total area of the P-V diagram.
In the process; the indicator instrument is placed on the indicator cock with its drum in phase with the piston movement. The P-V diagram ( Indicator Diagram ) illustrates the variation of cylinder pressure; concerning the piston movement. The area of the diagram is calculated using a planimeter/platometer; and then multiplied by the cylinder constant and the engine speed.
Here the pressure curve starts at the atmosphere line and increases quite slowly as the piston starts to move up within the cylinder. Now when the compression starts after the end of the scavenging process; the pressure increase exponentially.
The pressure rises to the peak pressure at the time of combustion and then starts to fall as the piston starts to move down. The exhaust valve opens and the pressure further reduces down and came close to the atmospheric level.
2 ) Draw Card Diagram
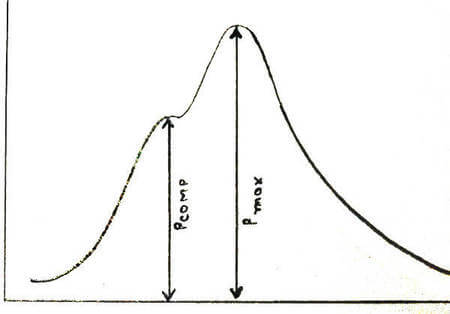
The drawcard diagram is taken with the same indicator instrument; with its drum 90 degrees out of phase with the piston movement. It gives us a better understanding of pressure variation within the cylinder. Thus it helps us differentiate between the compression pressure and peak pressure for the particular cylinder.
Using the drawcard diagram we get a clear indication of the faults in exhaust, injection and exhaust systems. Even effects for improper settings of the indicator instrument are much clear in this diagram. The area of this diagram gives us the mean indicated pressure or the total power produced for the system.
Here, in the drawcard diagram, the pressure rise as the piston starts to move up. Now the maximum pressure to which air pressure reaches before the start of the combustion process is called compression pressure.
This can be seen in the form of a small bulge in the diagram. Combustion starts and the pressure rise again and then falls gradually as the expansion and exhaust stroke starts to happen.
3 ) Light Spring Diagram
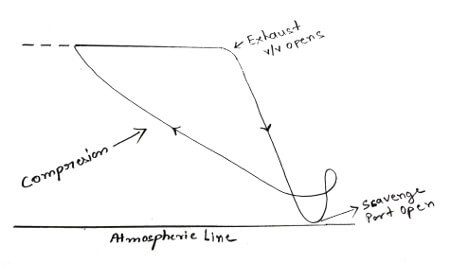
A light spring diagram is taken when there is suspected irregularity in the exhaust and inlet stroke. It scales and enlarges the deviation in pressure enough to be visible. So the pressure changes during scavenging and exhaust can be monitored and required changes are been done.
The light spring diagram is taken with the same indicator instrument in a way much similar to the power card diagram. The only catch is, here we use light compression spring fitted to the indicator instrument. The light spring allows the device to be operationally sensitive during the exhaust and scavenging procedure while the working pressure is much low.
In the case of the light spring diagram, there is an instantaneous drop in-cylinder pressure as the exhaust valve opens. It falls close to the atmospheric line when the scavenge ports uncover and pressure starts to increase. The air pressure increases throughout the compression stroke and represented as a straight line during the combustion process.
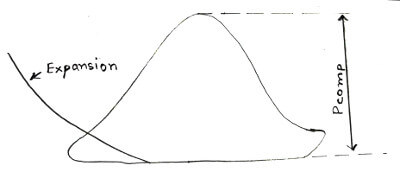
4 ) Compression Diagram
A compression diagram is used mainly to determine major faults in the unit. While confirming the correct synchronization of the instrument with the piston movement at the same time. In the diagram, if the compression and compression diagram lines coincide; it means the instrument is correctly syncronized and working properly.
Similarly, the total height of the curve represents compression pressure; while a much lower compression curve is an indication of liner wear, leaky exhaust valves, worn-out piston rings or insufficient scavenge air. The process of taking the compression diagram is simple and is exactly like the power card diagram, but with the fuel injector shuts off.
The compression diagram gives us a clear picture of pressure change within the cylinder. This helps us know better about the effects of valves and ports on cylinder pressure.
Correct Procedure / Steps To Take Indicator Diagram
- Prepare the indicator valve and the indicator instrument for taking the reading.
- In the case of digital indicator make sure your data acquisition unit is fully charged and functional.
- Take full safety precautions with appropriate PPE ex: high-temperature gloves, hard hat, eye protection, etc.
- Keep the engine running at a constant speed.
- Operate the indicator cock with care and make sure the line is clear of any shoot particle before use. ( Do a short blow through )
- Dismantle the upper part of the indicator instrument before mounting to ensure its various recesses are clean.
- Fit the indicator and cord in a firm tight position.
- Now engage the indicator drive and check for alignment; so the diagram is traced in the middle of the paper/sheet.
- With the indicator cock shut press the stylus against the paper to draw the atmospheric line.
- To draw the indicator diagram release the cord from the indicator drive and slowly open the indicator cock.
- Press the stylus slightly against the paper while pulling the roller string as it traces the diagram on paper.
- Close the indicator cock and remove the instrument.
- Check that the diagram drawn is correctly visible and distinct.
Distinct Steps To Be Taken In Case of Digital Instrument
- At first, connect the incremental encoder to the data acquisition unit using a probe.
- Using proper tools and kit to open the indicator cock and give a short blow through.
- Now connect the handheld data acquisition unit to the pressure transducer probe.
- Before installing the pressure transducer unit of the indicator instrument; onto the indicator cock, make sure it is clean and clear of shoot particles.
- Fix the pressure transducer onto the indicator cock.
- Take readings and data for the complete combustion process for all cylinders one by one.
- Disconnect all the probes and units and send the obtained data to finalization software for the final diagram/result.
Types of Diagram Deficiencies
Any deviation in the diagram from the idle condition represents a fault in either of the applied parts; indicator instrument, exhaust valve, liner, piston rings, fuel injector, and fuel pump. Diagram deficiencies due to incorrect adjustment of indicator instrument, cam or its drive can be thus be easily rectified and separated off other deflections.
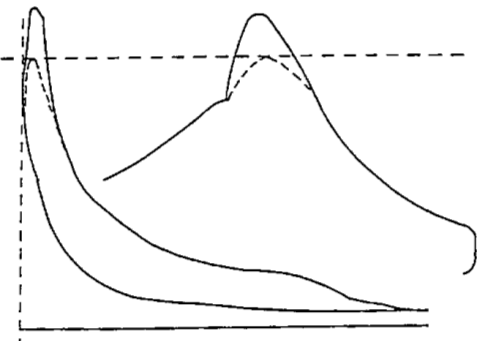
I have been often asked why drawcard diagram shows two pressure peaks; while power card diagram just one? It is so because of the necessary ignition delay by 2 to 3 degrees. This allows to keep the Pcomp – Pmax within specified limits; while still maintaining optimum engine/combustion performance.
Type 1 Indicator Diagram Deficiency
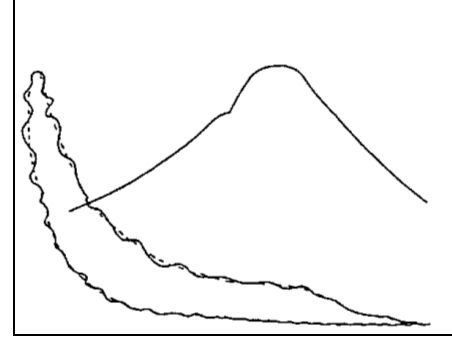
Here, In this diagram, the drawcard diagram is the same as idle but the power card diagram is unsteady and irregular. This type of diagram is obtained when there is a problem with the indicator instrument. Such diagram deficiency represents vibration in the drive affecting the power card diagram only.
Type 2 Indicator Diagram Deficiency
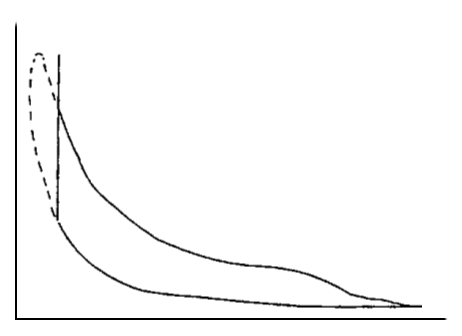
Here, In this diagram for the power card diagram the entire TDC part will be missing. You can see that in the form of a straight verticle line that goes straight up and then meets the regular graph. This kind of diagram deficiency is also due to fault with the indicator instrument; particularly length of the cord being too long.
Type 3 Indicator Diagram Deficiency
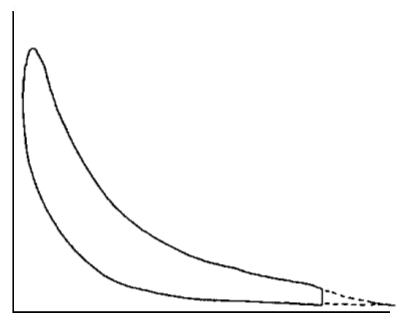
Here, In this diagram for the power card diagram the entire BDC part will be missing. You can see that in the form of a straight verticle line at the bottom that goes straight up and then meets the regular graph. This kind of diagram deficiency is also due to fault with the indicator instrument; particularly length of the cord being too Short.
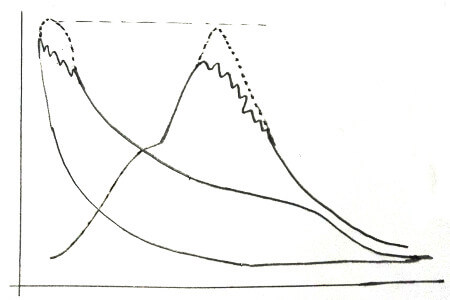
Type 4 Indicator Diagram Deficiency
Here, In this diagram both power and drawcard diagrams show irregular curves with vibrations. This kind of faulty diagram with a large working area is obtained when there is an issue with an indicator instrument. This situation in which both diagrams are affected arises when there is friction in the indicator piston.
Type 5 Diagram Deficiency
Here, In this diagram, there is flat line representation on the top which explains the indicator piston strikes the end of the cylinder. This is another diagram deficiency obtained due to the faulty indicator instrument. The root cause of this issue is having a weak spring for the indicator instrument.
Type 6 Diagram Deficiency
Here in this diagram, we see an untrue representation of the atmospheric line; which arises due to leaky indicator cock.
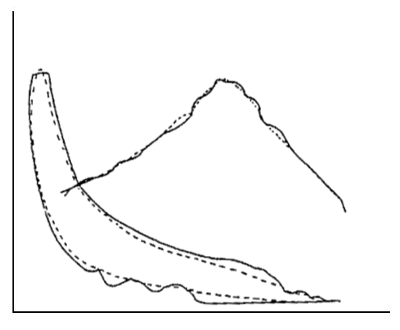
Type 7 Diagram Deficiency
When this diagram is compared to the standard power and drawcard diagram we will find; that compression and peak pressure is much lower than expected. Moreover, in the drawcard diagram, there is little difference between the maximum and the compression pressure. Such irregularity in diagram can be due to one of the following factor:
- Defective Fuel valves
- Fuel pressure too low or defective fuel pump
- Bad quality of fuel
- Chocked fuel injector and its nozzle
- Leaky fuel pumps or it’s lead too little.
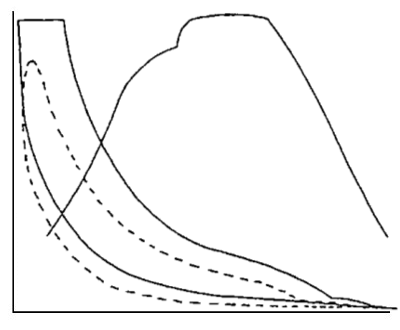
Type 8 Diagram Deficiency
When this diagram is compared to the standard power and drawcard diagram we will find; that the peak pressure for both draw and power card diagrams is much higher than expected. Moreover, the difference between the peak and the compression pressure in the drawcard is much higher now. Such deficiency in diagram is due to:
- Overheated parts
- Fuel pump lead too large
- Incorrect or wrongly set fuel spring / Incorrect fuel pump timing
- Early injection
- Poor fuel condition.
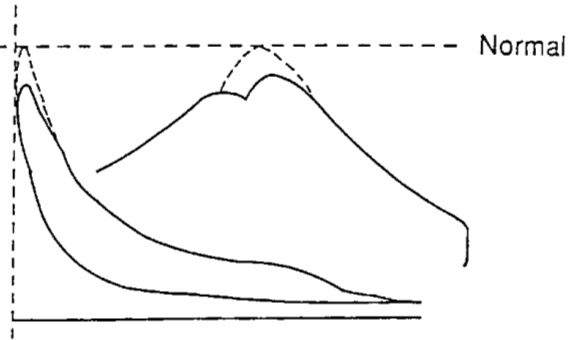
Type 9 Diagram Deficiency
This type 9 diagram irregularity is mainly due to the lack of compression or lower compression. Here the drawcard diagram up till the completion of the combustion process; stays lower than the usual. This then reflects into lower power generated and higher exhaust temperature. Such irregularity in the diagram can be due to one of the following factor:
- Faulty turbocharger, inlet valves or air cooler.
- Chocked scavenge ports, air cooler, and air filter.
- Engine blow-by due to broken or faulty piston rings.
- Blow past due to liner wear or lack of lubrication.
- Sticky piston rings.
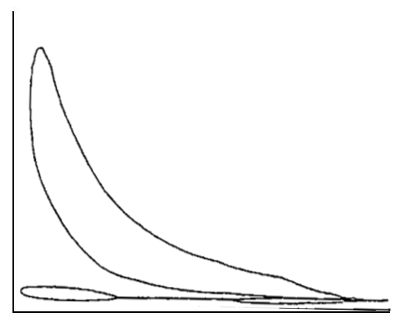
Type 10 Diagram Deficiency
When this diagram is compared to the standard power and drawcard diagram we find that; here the peak pressure is low for both the case. Such a graph is mainly produced due to leakages, increased cylindrical volume or fouling. But the actual cause remains one of the following conditions:
- Exhaust valve seat leakage
- Piston ring blow-by
- Leaky fuel injector
- Fouling of injector nozzles with carbon particles.
Also Read:
- What Are Marine Fenders? Its Types & Function
- Electronic Control Unit – How It Control Engine Performance?
- How To Start And Reverse The Marine Diesel Engine
- What Are Bearings? Its Types And Application